The Best Pitchers to Target at the MLB Trade Deadline
We are about one month away from the MLB trade deadline - who are the best pitchers that may be made available this season?
MLB’s Early Season Breakout Pitchers
One of my favorite analyses of the season is the first xwFIP leaderboard. xwFIP’s ability to reach statistical significance earlier in the season, due to the metric’s incorporation of all batted balls, quickly leads to some interesting insights.
Photo Credit: Denis Poroy/Imagn Images
Where Does Superstar Shohei Ohtani Rank in The 2025 xwFIP Leaderboard?
With the League Championship series underway, here is the final xwFIP post of the season!
Photo Credit: Harry How/Getty Images
Why the Cuban Missile Is Having a Career Year
Aroldis Chapman is atop the 2025 xwFIP rankings through August. How is the 37-year-old Red Sox closer having so much success this year?
Photo Credit: Orlando Ramirez/Getty Images
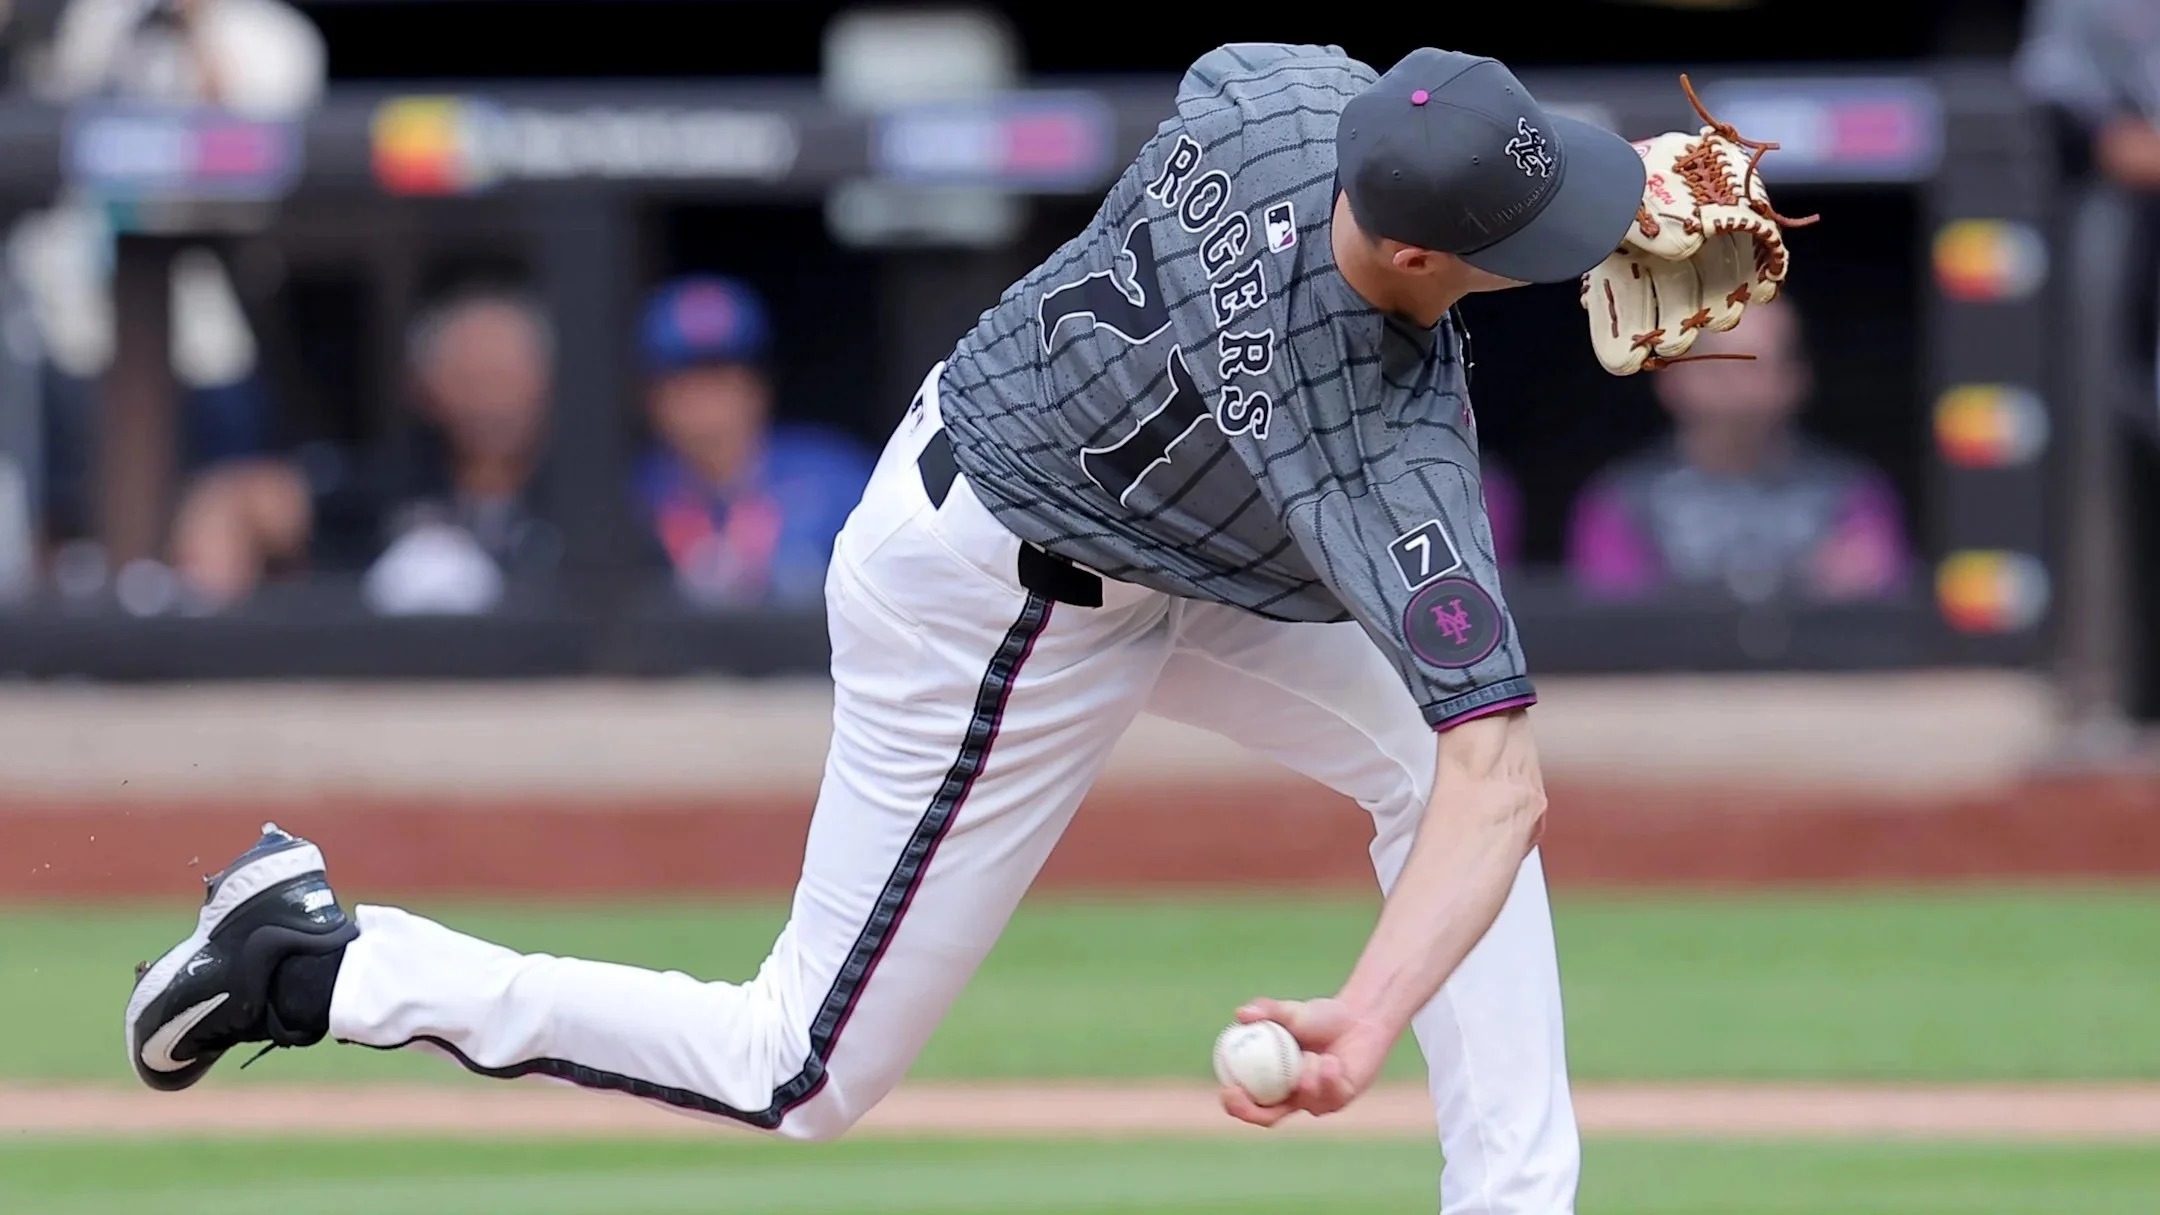
What Were The Top Trade Deadline Pitching Acquisitions?
This year’s trade deadline had a flurry of action up until the last minute. In this post I’ll discuss the top arms that postseason contenders were able to add.
Photo Credit: Brad Penner/Imagn Images

Who is The Best Pitcher in Baseball at the Halfway Point of the Season?
We are halfway through the baseball season! Who is standing out as the best pitcher?
Photo Credit: Thomas Shea/Imagn Images

There’s a Hidden Gem at the Back of the Yankees Rotation
The xwFIP leaderboard for May is out!
Photo Credit: MLB.com

Is Mason Miller Still King?
Just over one month into the MLB season, we have a sample size large enough for our first xwFIP leaderboard of the year. Is Mason Miller still king?
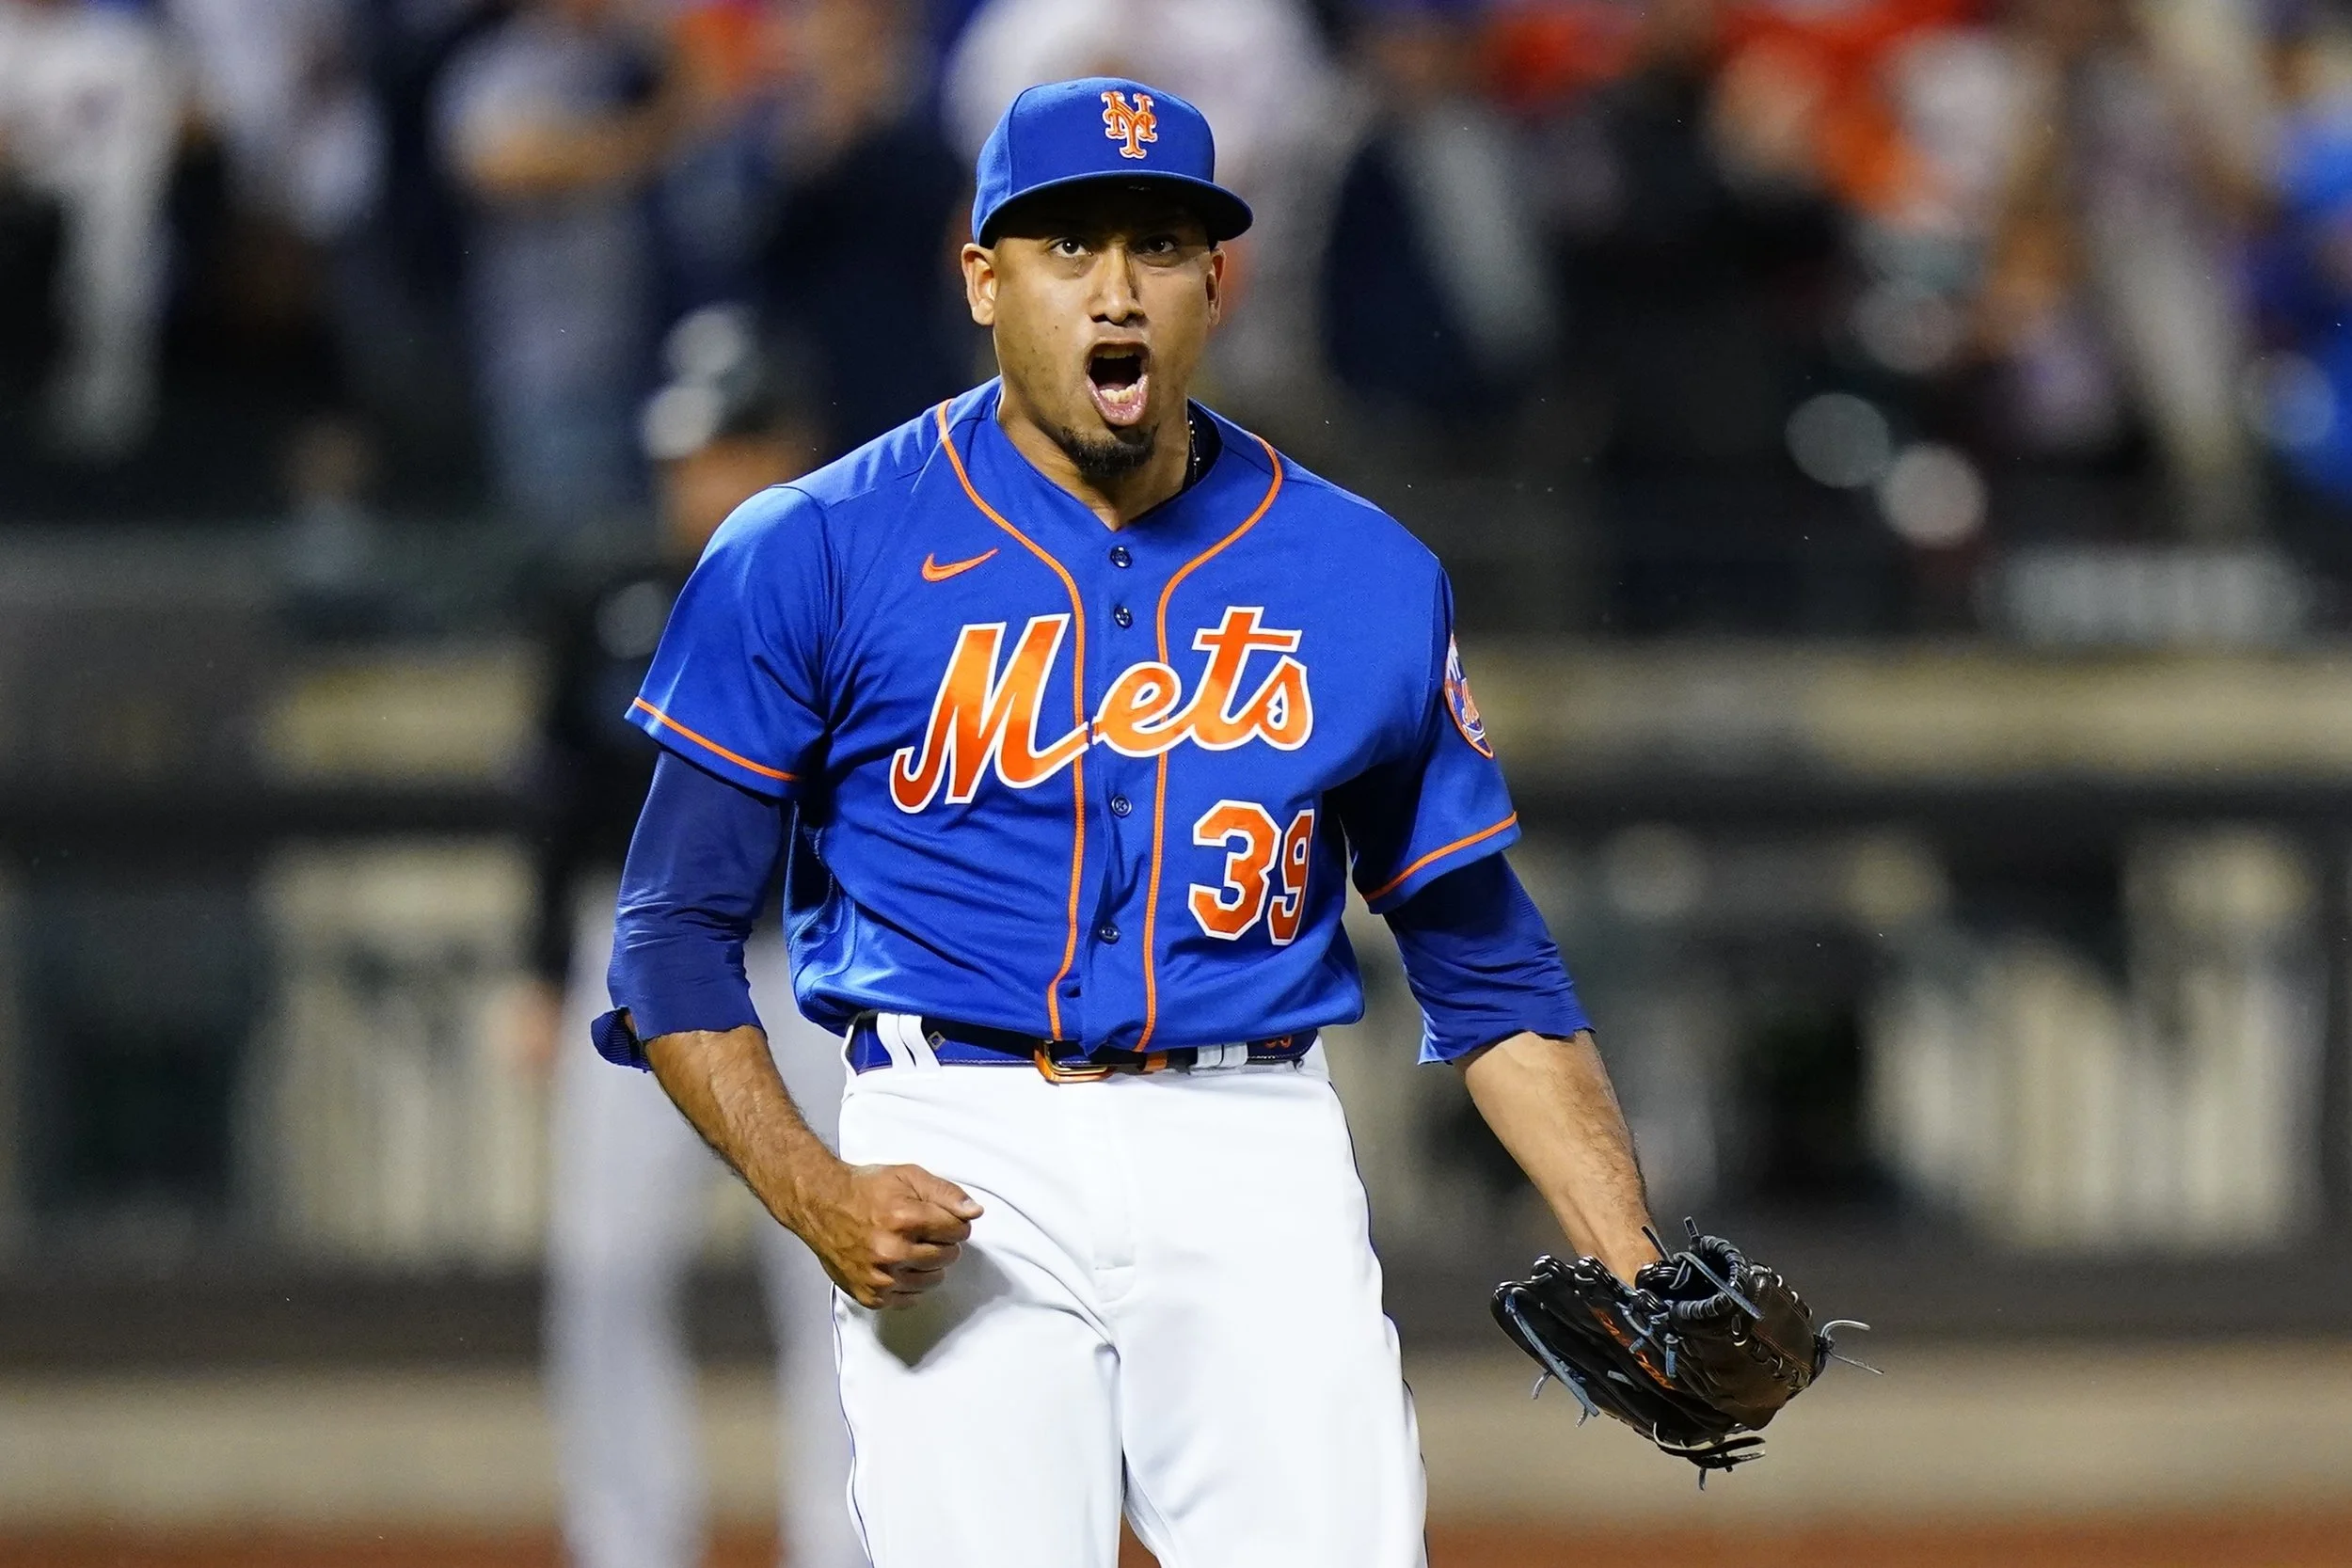
Which Playoff Teams Have the Most Dominant Pitching?
October baseball is in full swing, and the Wild Card round didn’t disappoint! We saw some stunning upsets: the Tigers ousted the Astros, the Royals knocked out the Orioles, the Mets took down the Brewers, and the Padres triumphed over the Braves in the only series in which the home team won. Now, with just eight teams remaining, it's time for my final xwFIP analysis of the season. I'll be crowning the regular season champions among all pitchers and starters, and taking a deep dive into which playoff pitching staffs are best equipped to silence opposing lineups this fall.
Photo Credit: Frank Franklin II/Associated Press

Evaluating Fangraphs Playoff Projections
As the September playoff race heats up, key division battles are emerging: the Yankees are locked in with the Orioles in the AL East, and the Guardians are head-to-head against the Royals in the AL Central. The Wild Card chase is just as exciting, with the Twins and Tigers vying for the final AL spot, while the Padres, Diamondbacks, Mets, and Braves compete in the NL. Meanwhile, the Phillies, Dodgers, and Brewers are jockeying for the top two seeds in the National League, hoping to capture the first round bye.
This post will introduce a Paraball Win Probability Model that assesses a team's chances in matchups against a .500 opponent. I will compare its results with Fangraphs’ Playoff Simulation to identify teams that Fangraphs overvalues or undervalues.

Introducing pWAR and Using It to Predict Who Wins Cy Young
Who will win the AL and NL Cy Young Awards? In this analysis, I’ll introduce a new cumulative win value statistic, Paraball Wins Above Replacement, orpWAR, in order to identify the most deserving candidates.
Photo Credit: Any Lyons/Getty Images
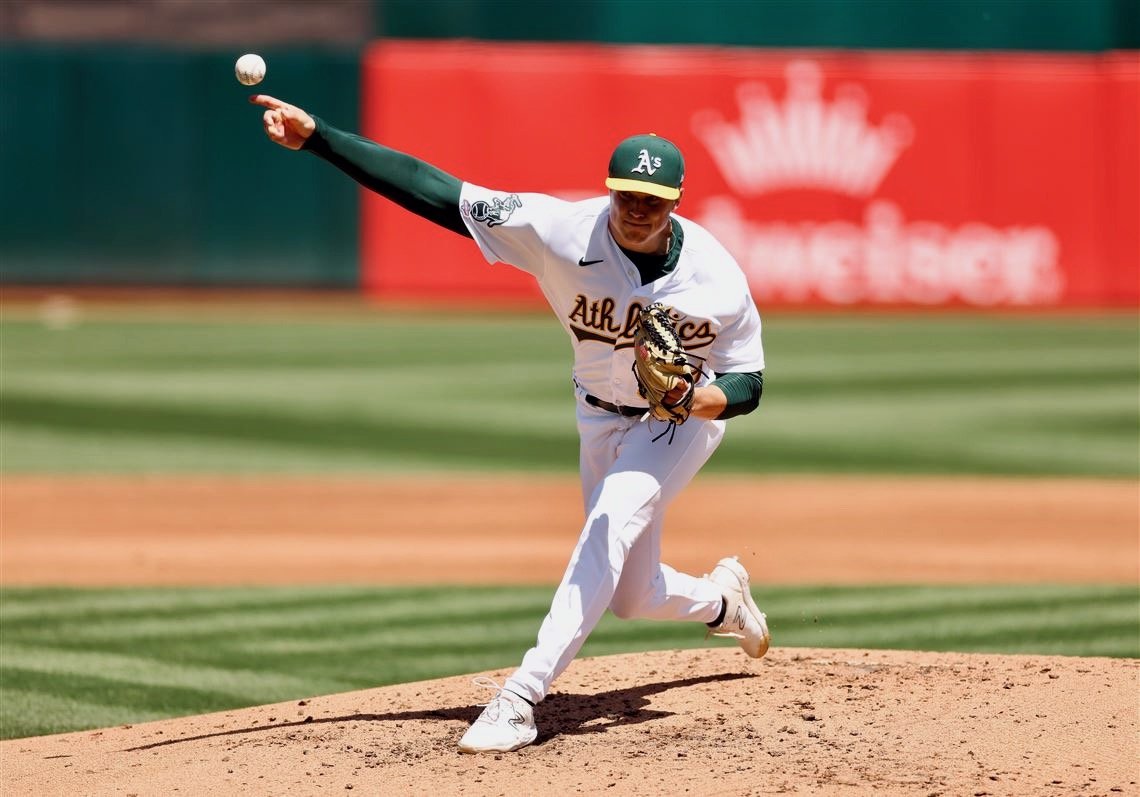
The Pitchers with the Best xwFIP: April Edition
This past offseason, I introduced the pitching metric xwFIP in a series of three posts. xwFIP is an advanced fielding independent pitching metric that not only takes into account walks, hit batsmen, strikeouts, and homeruns, but also the xwOBA on batted balls. The metric takes into account nearly 100% of plate appearances in its calculation. Moreoever, I have showcased that it has greater predictive power than each of ERA, wOBA, FIP, xFIP, xwOBA, and SIERA in predicting future run prevention performance of a pitcher.
This season, I’ll be posting the xwFIP leaderboard each month so we can see the starters and relievers that are most likely to have continued success, along with the pitchers who have been lucky and unlucky so far.
Photo Credit: Ezra Shaw/Getty Images

Quantifying Momentum in the NFL
Sunday’s NFC championship game between the Detroit Lions and the San Francisco 49ers was a roller coaster ride. The Lions seized a 17 point lead by halftime, only to see the 49ers storm back and win the game 34-31. In the second half, the Lions turned the ball over on downs twice after going for 4th and 2 at the SF 28 yard line and 4th and 3 at the SF 30 yard line. Each of those failed plays appeared to energize the Santa Clara crowd and help propel the home team to the Super Bowl.
Watching the game had me thinking: can we quantify momentum in the NFL?
Photo Credit: Kyle Terada/USA TODAY Sports

Introducing Pitching Stat LBAbip
BAbip, batting average on balls in play, serves as a valuable statistic for gauging pitchers' luck in the frequency of balls in play (excluding homeruns) that lead to base hits. Conventionally, a pitcher’s BAbip is compared to the league average BAbip when assessing how lucky or unlucky a pitcher has been. In this analysis, I’ll introduce a more sophisticated point of comparison: location-based batting average on balls in play (LBAbip). I will use LBAbip to identify pitchers who are likely to regress to the mean in 2024.
Photo Credit: Adam Glanzman/Getty Images
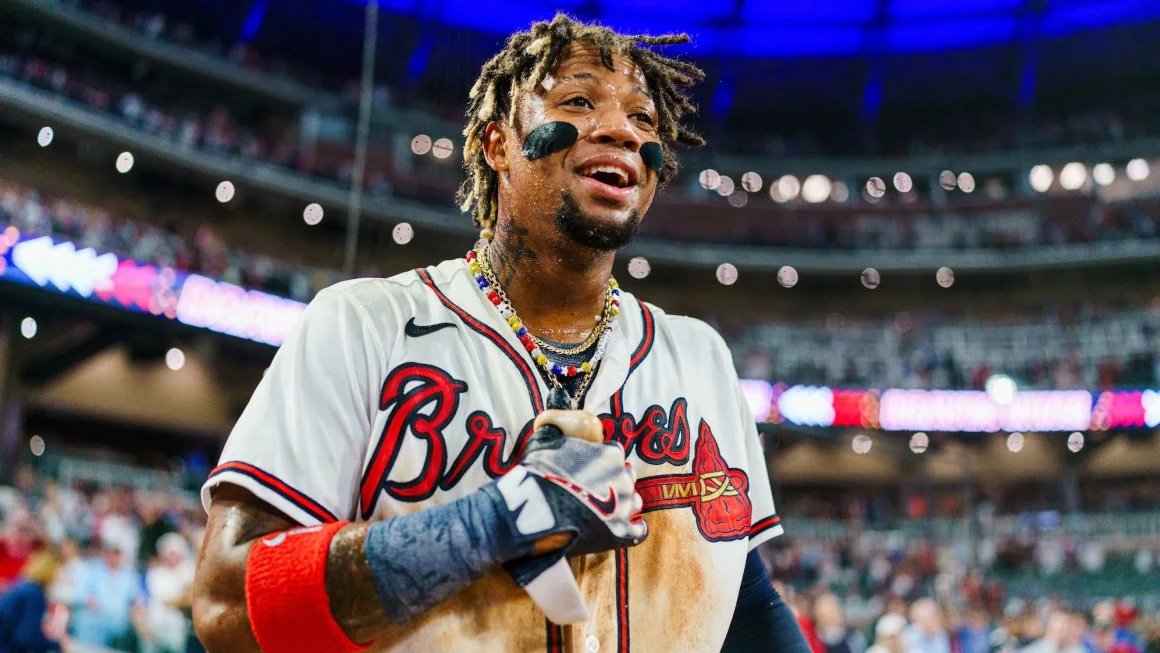
Using Predictive wOBA To Predict 2024 Batting Performance
In a previous post, I proved via correlation that Predictive wOBA (including all batted balls, walks, strikeouts, and hit-by-pitches), is better at predicting Next Season wOBA than both wOBA and xwWOBA. I also showed how a mean-regression technique, resulting in Modified Predictive wOBA, strengthened the model’s predictive power even further.
In this post, I’ll use Modified Predictive wOBA to project performances in the coming baseball season and compare them to Steamer’s 2024 projections.
Photo Credit: Matthew Grimes Jr./Atlanta Braves/Getty Images
How Can We Make Predictive wOBA Even More Predictive?
Last week, Tom Tango introduced the concept of Predictive wOBA, and through correlation analysis, he demonstrated that Predictive wOBA exhibits stronger predictive capabilities for Next Season wOBA than both wOBA and xwOBA. Is there a way to further improve Predictive wOBA?
In this post, I’ll examine the predictive power of a slightly different version of Predictive wOBA, incorporating walks, strikeouts, and hit-by-pitches, along with all batted balls.
Photo Credit: Michael Reaves/Getty Images

The Updated xwFIP
I received a very good comment from reader Light_Saberist on one of my latests posts, in which I compared the predictive powers of xwFIP and FIP.
In order to determine the xHR of a pitcher, xFIP (not to be confused with xwFIP) uses the league average homerun/flyball rate of 10.5% and multiplies that rate by the number of flyballs the pitcher allows. This logic may mitigate some of the luck factors in allowing homeruns and thus strengthen xwFIP as well. I checked that hypothesis, and it was correct!
Photo Credit: Daniel Varnado

Comparing The Predictive Powers of xwFIP and FIP
In my previous post, I introduced an enhanced version of FIP - named xwFIP - which incorporates batted ball data and 100% of plate appearances while remaining completely fielding independent. But how is xwFIP’s ability to predict future pitching success? Let’s have a look.
Photo Credit: The Athletic
Introducing xwFIP: An Expansion of Baseball’s Most Powerful Pitching Statistic
Since Tom Tango introduced Fielding Independent Pitching (FIP) to the baseball community around the year of 2009, the metric has been the gold standard for evaluating pitching performance. Tango has effectively proven that FIP is a better predictor of future pitching success than ERA. FIP’s special sauce is its ability to filter for outcomes that are directly related to pitcher performance—home runs, walks, hit batsmen, and strikeouts. Since it’s difficult for the baseball community to assign credit or blame for groundouts, flyouts, and base hits, all of which are largely dependent on the ability of the pitcher’s fielders, these outcomes are treated equally.
Homeruns, walks, hit batsmen, and strikeouts accounted for only 35.7% of plate appearances (PAs) in 2023. However, if we are able to add batted ball data* to FIP, while keeping the metric completely independent of fielding, we can cover 100% of PAs. In this analysis, I will have a go at doing exactly that.
Photo Credit: Orlando Ramirez/USA TODAY Sports
Paraball Win Share: A New Win Expectancy Tool
Watching the Wild Card Series the last few days, I’ve found myself thinking of win expectancy tools. Baseball has a long history of using empirical formulas to estimate a team's expected win total based on run differentials. This practice dates back to the days of the Bill James Pythagorean Theorem and has undergone refinement over the years. While run differential remains a powerful tool for assessing a team's quality independently of their win-loss record, it's not without limitations.
One notable flaw with the use of run differential is the consideration of blowout games. Every season there are teams that have many more blowout wins than losses, and teams that have many more blowout losses than wins. As a result, these teams have a skewed run differential and a skewed win expectancy. Not all runs should be treated equally; when a position player gives up 6 runs in the 9th to extend his team’s deficit to 16, those runs should be devalued.
This leads me to ask the question: Is there a better way to estimate win expectancy?
Photo Credit: Getty Images