The Best Pitchers to Target at the MLB Trade Deadline
We are about one month away from the MLB trade deadline - who are the best pitchers that may be made available this season?
MLB’s Early Season Breakout Pitchers
One of my favorite analyses of the season is the first xwFIP leaderboard. xwFIP’s ability to reach statistical significance earlier in the season, due to the metric’s incorporation of all batted balls, quickly leads to some interesting insights.
Photo Credit: Denis Poroy/Imagn Images
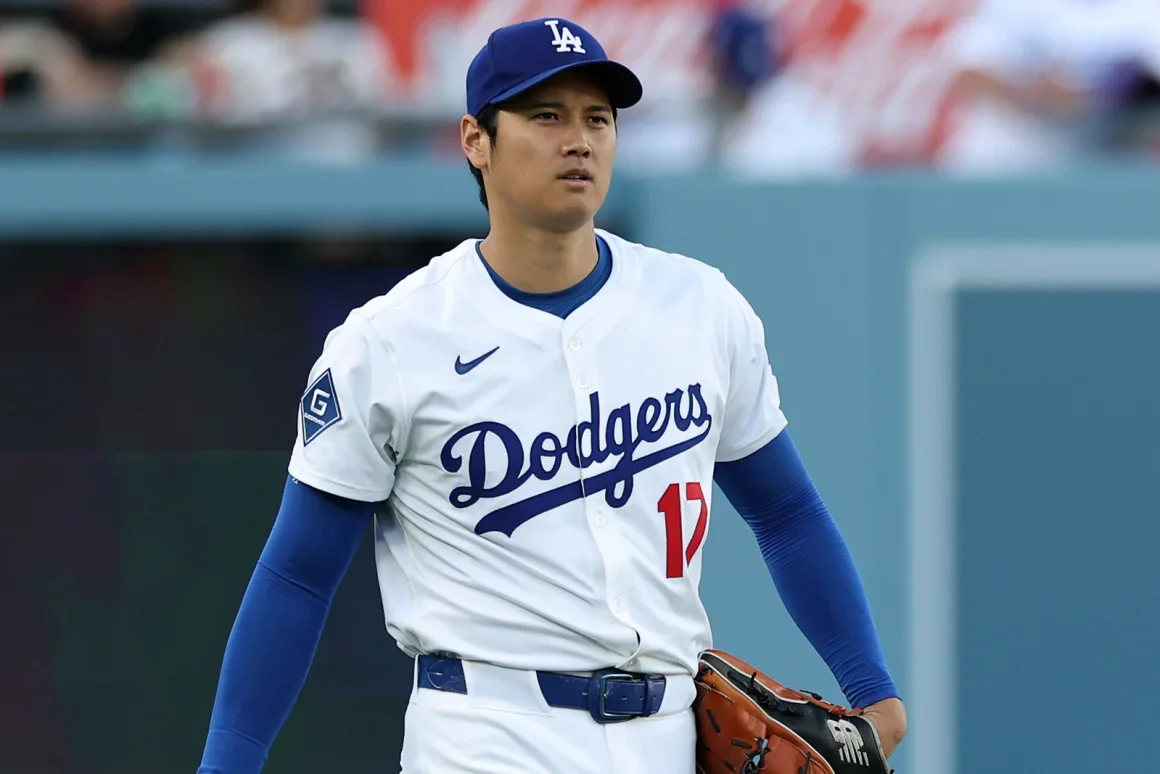
Where Does Superstar Shohei Ohtani Rank in The 2025 xwFIP Leaderboard?
With the League Championship series underway, here is the final xwFIP post of the season!
Photo Credit: Harry How/Getty Images
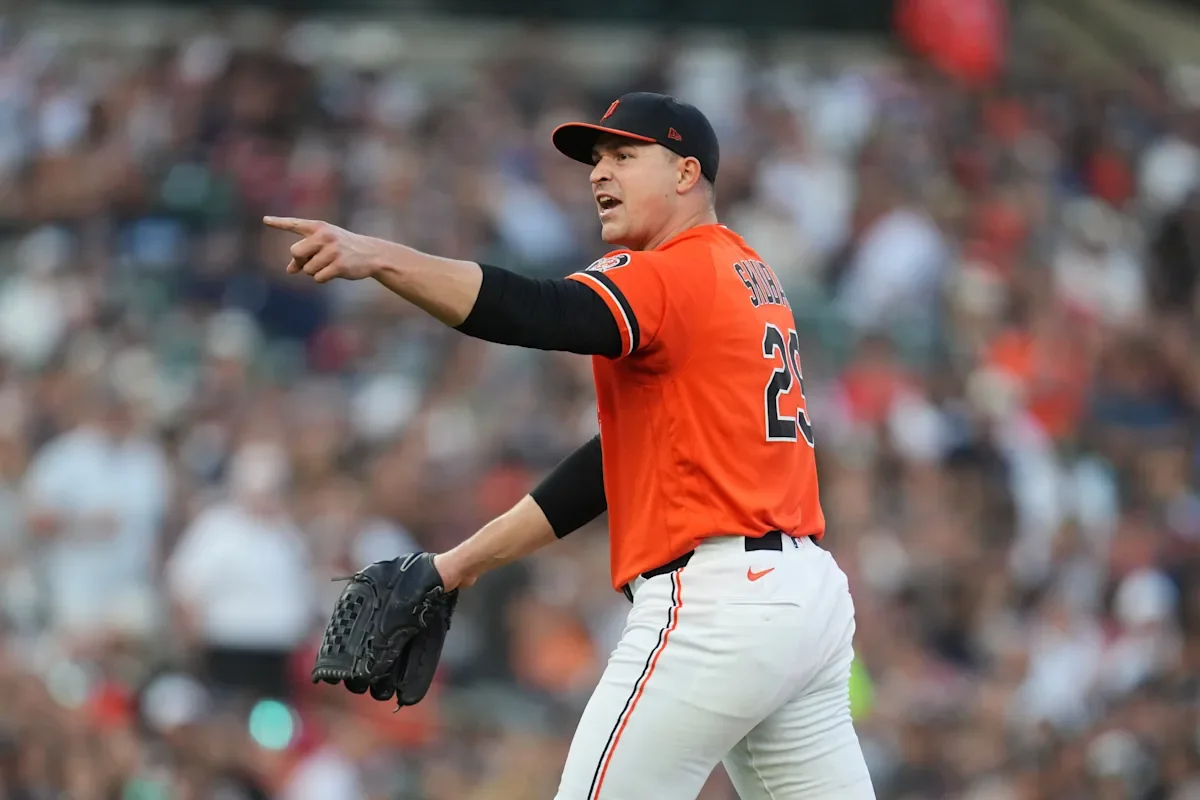
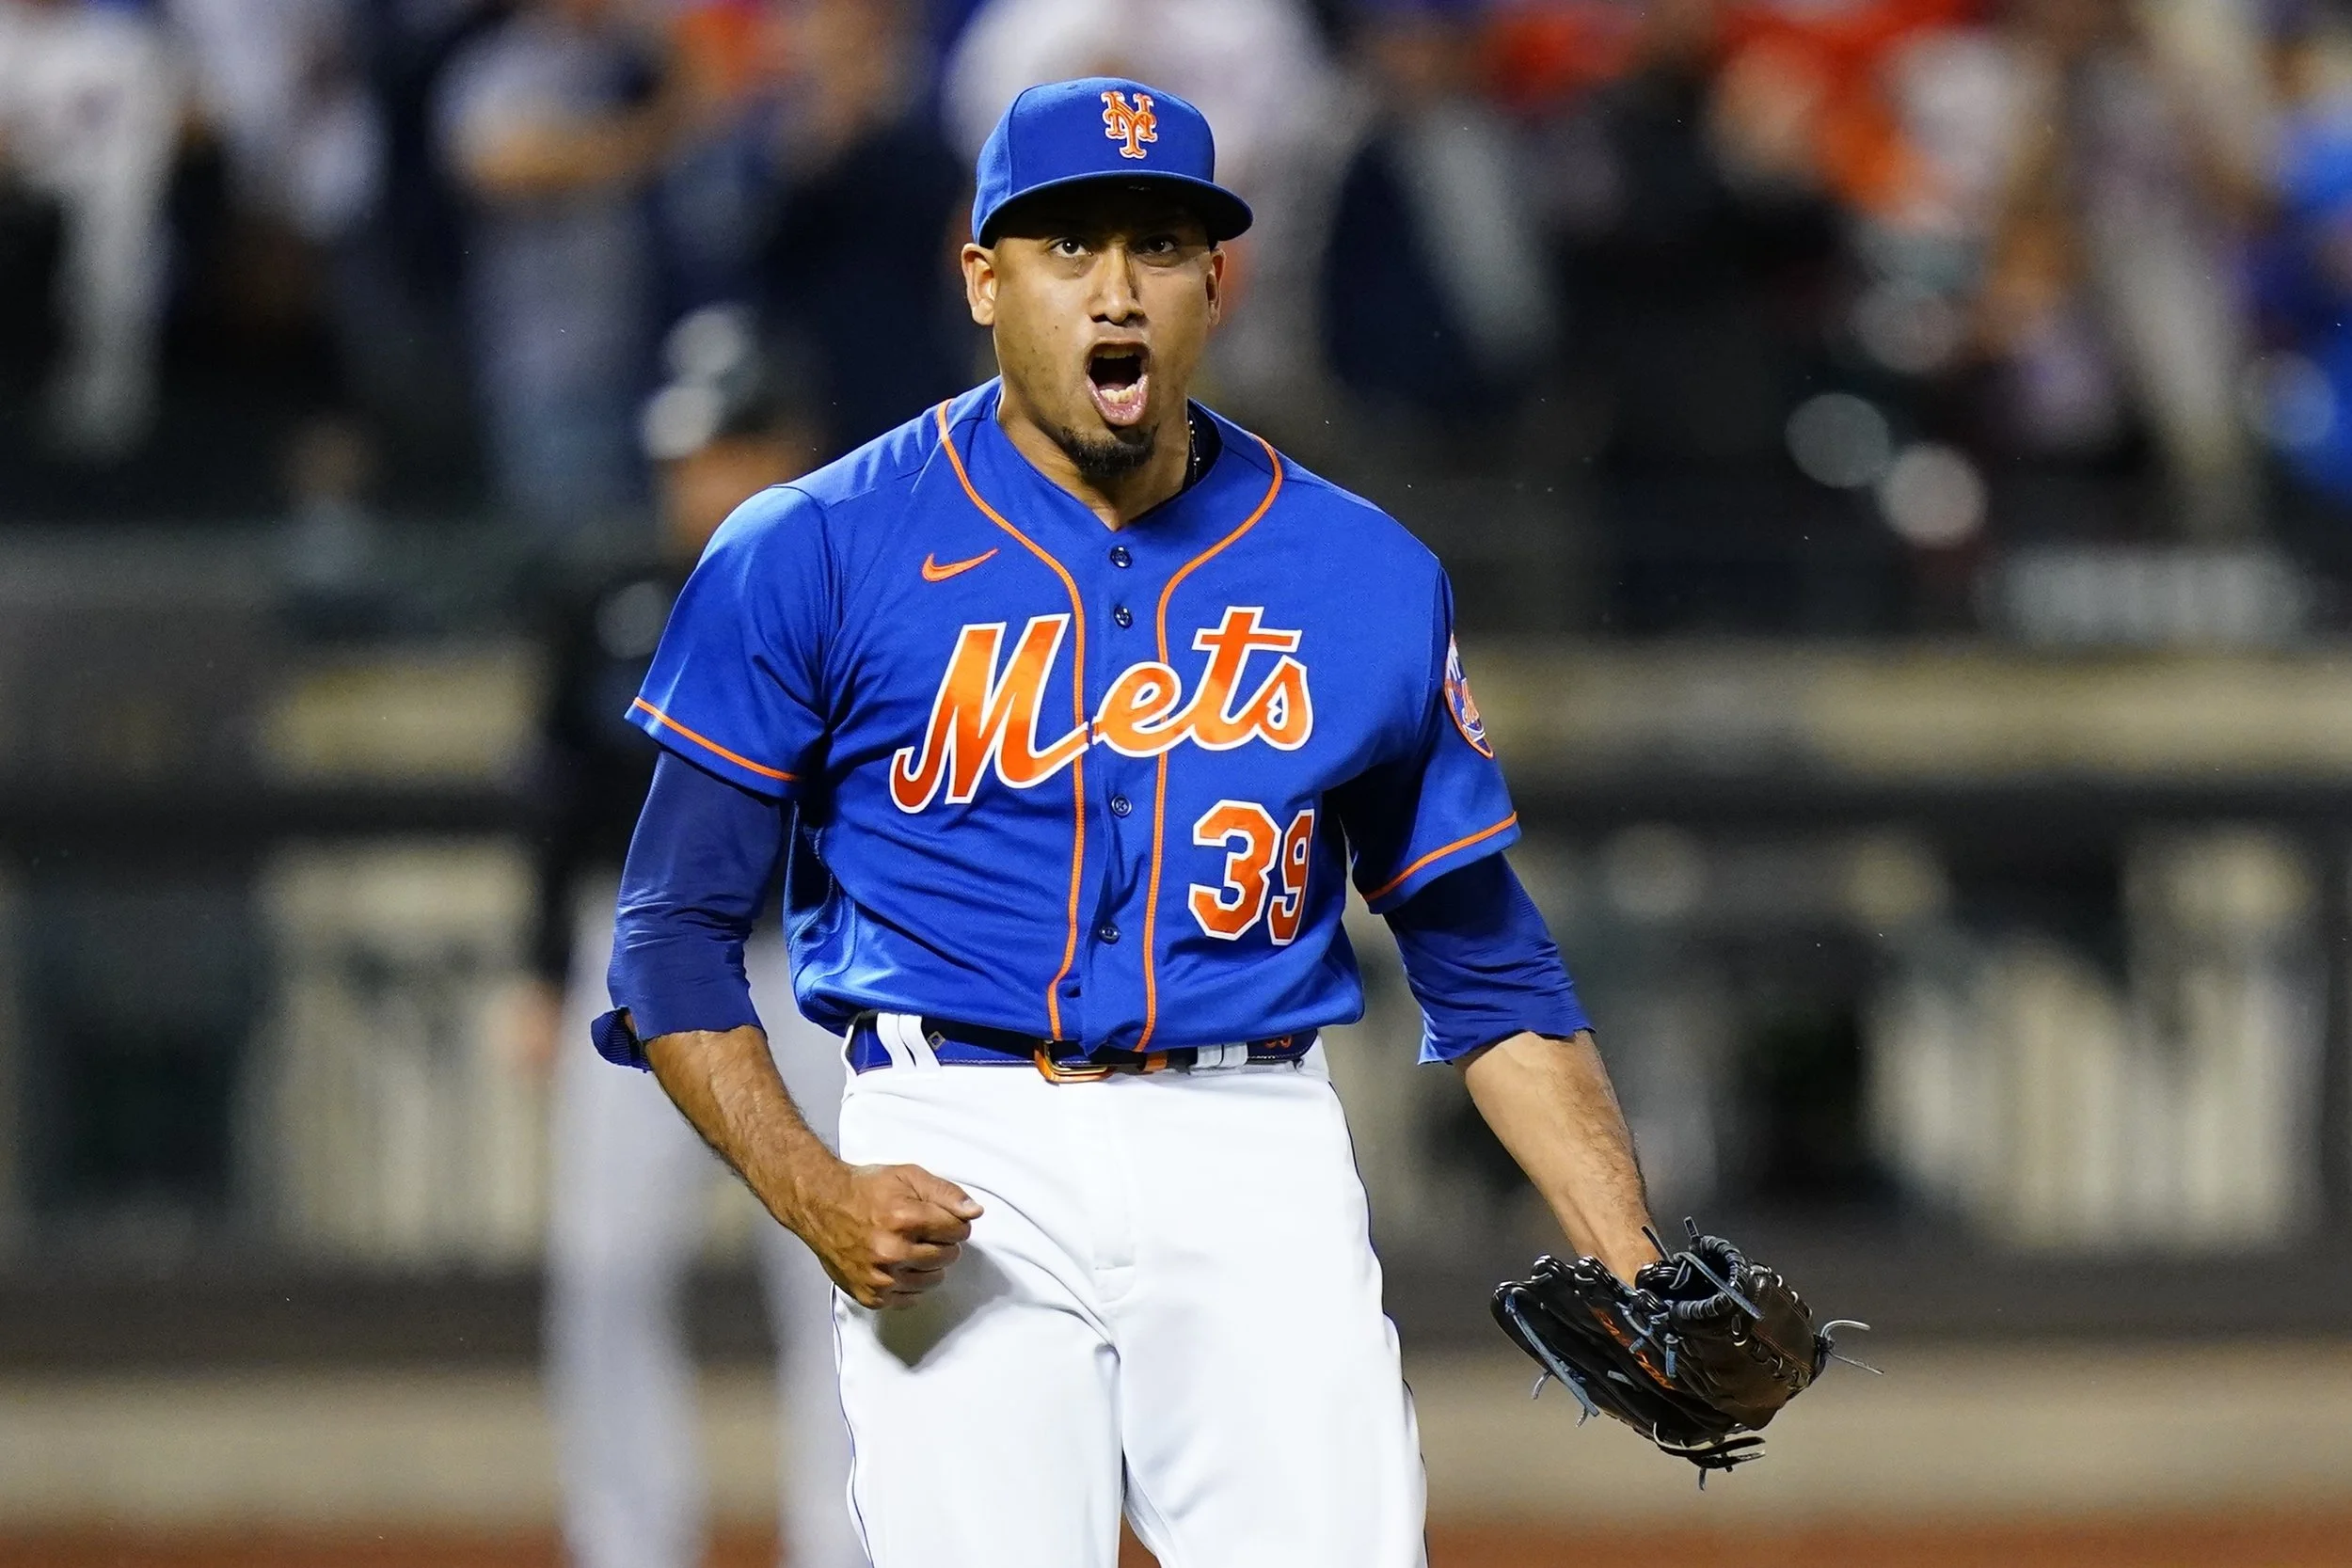
Why the Cuban Missile Is Having a Career Year
Aroldis Chapman is atop the 2025 xwFIP rankings through August. How is the 37-year-old Red Sox closer having so much success this year?
Photo Credit: Orlando Ramirez/Getty Images
What Were The Top Trade Deadline Pitching Acquisitions?
This year’s trade deadline had a flurry of action up until the last minute. In this post I’ll discuss the top arms that postseason contenders were able to add.
Photo Credit: Brad Penner/Imagn Images

Who is The Best Pitcher in Baseball at the Halfway Point of the Season?
We are halfway through the baseball season! Who is standing out as the best pitcher?
Photo Credit: Thomas Shea/Imagn Images

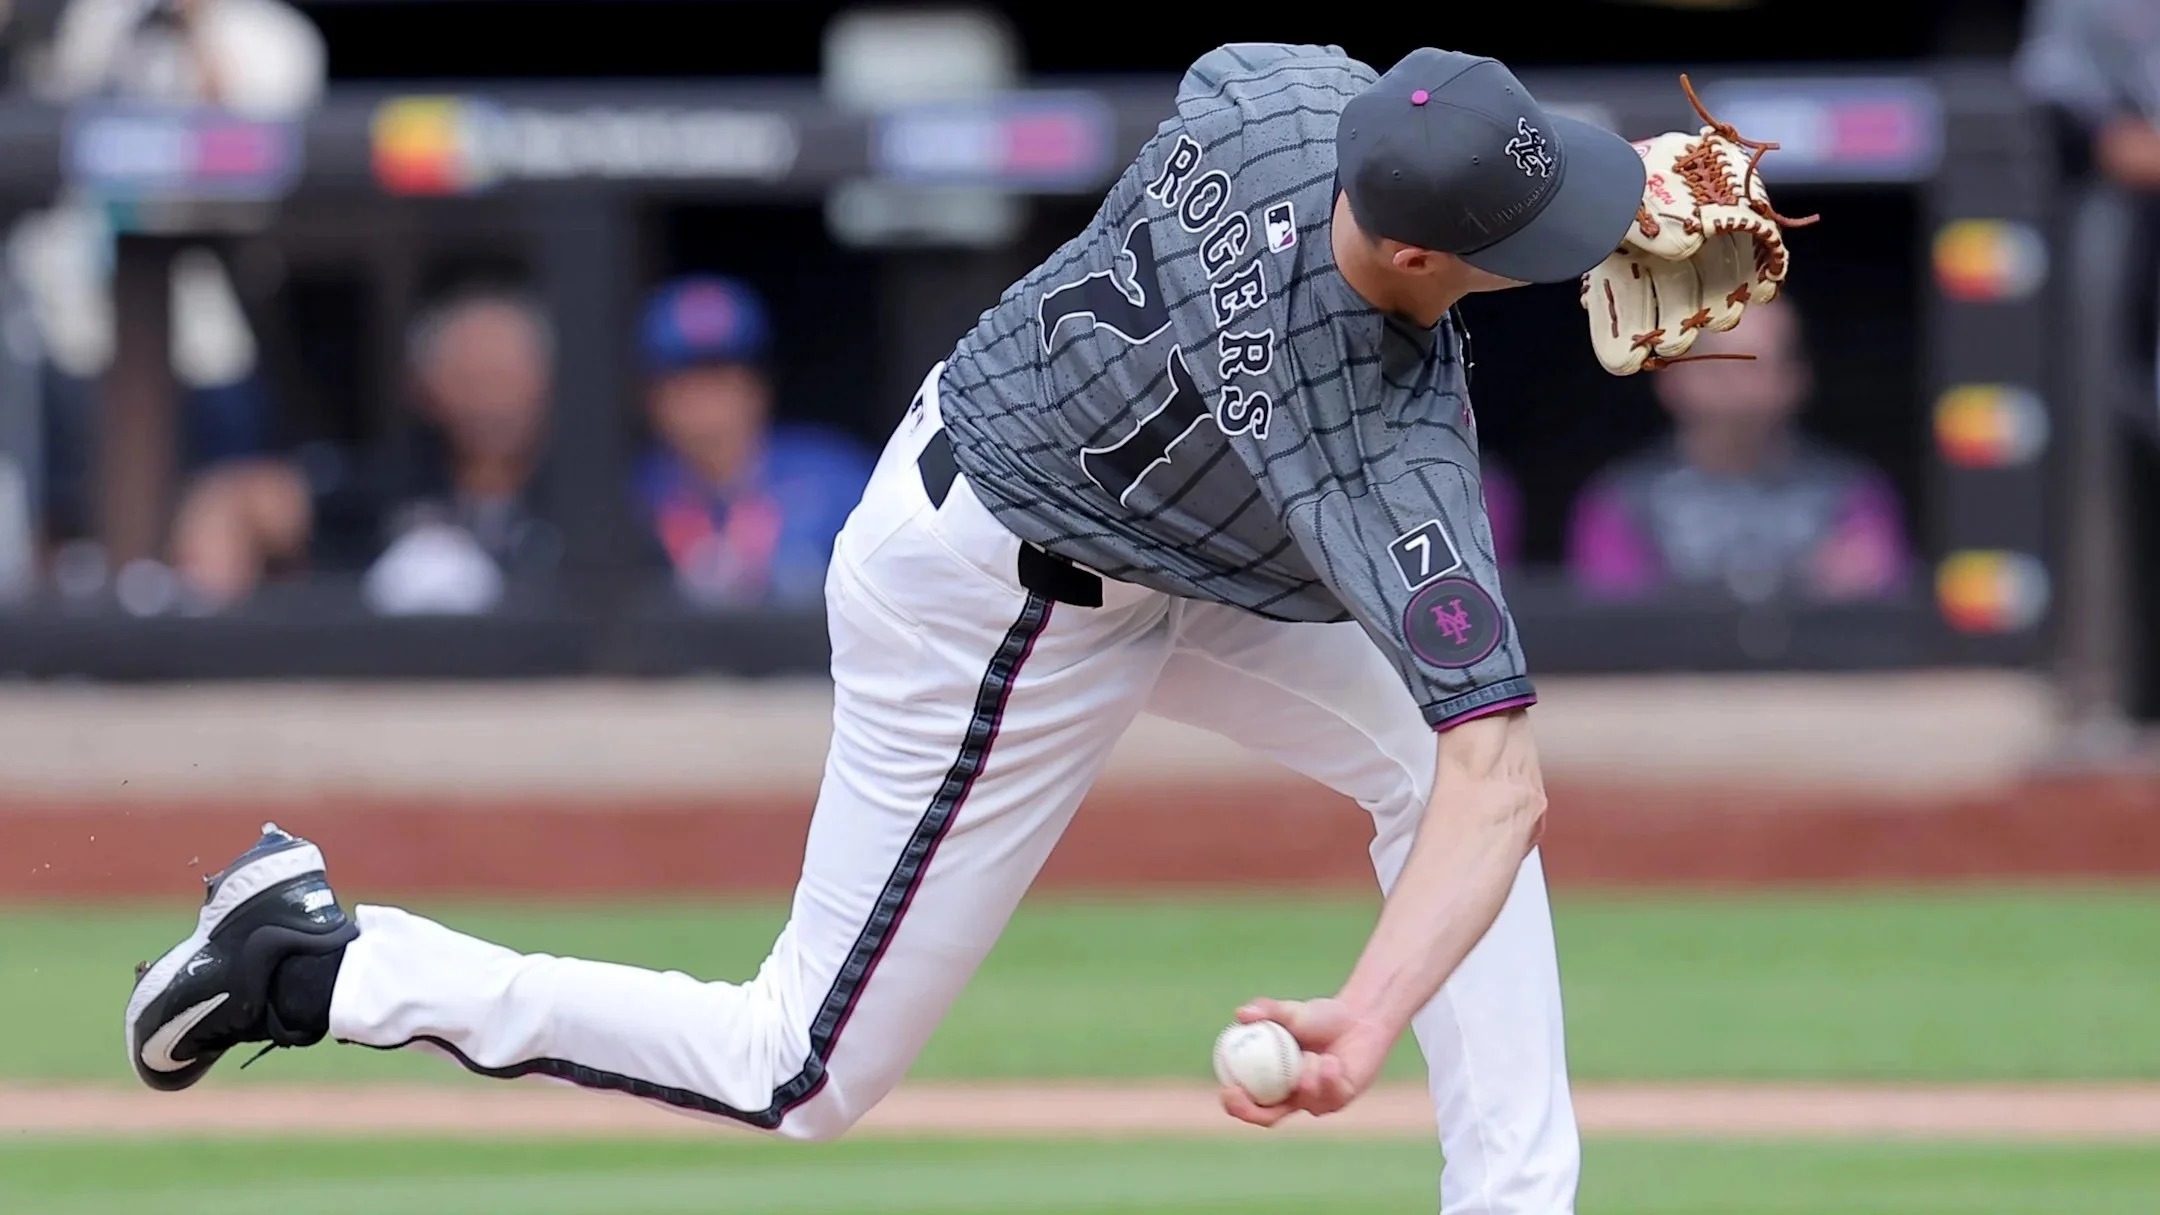
There’s a Hidden Gem at the Back of the Yankees Rotation
The xwFIP leaderboard for May is out!
Photo Credit: MLB.com

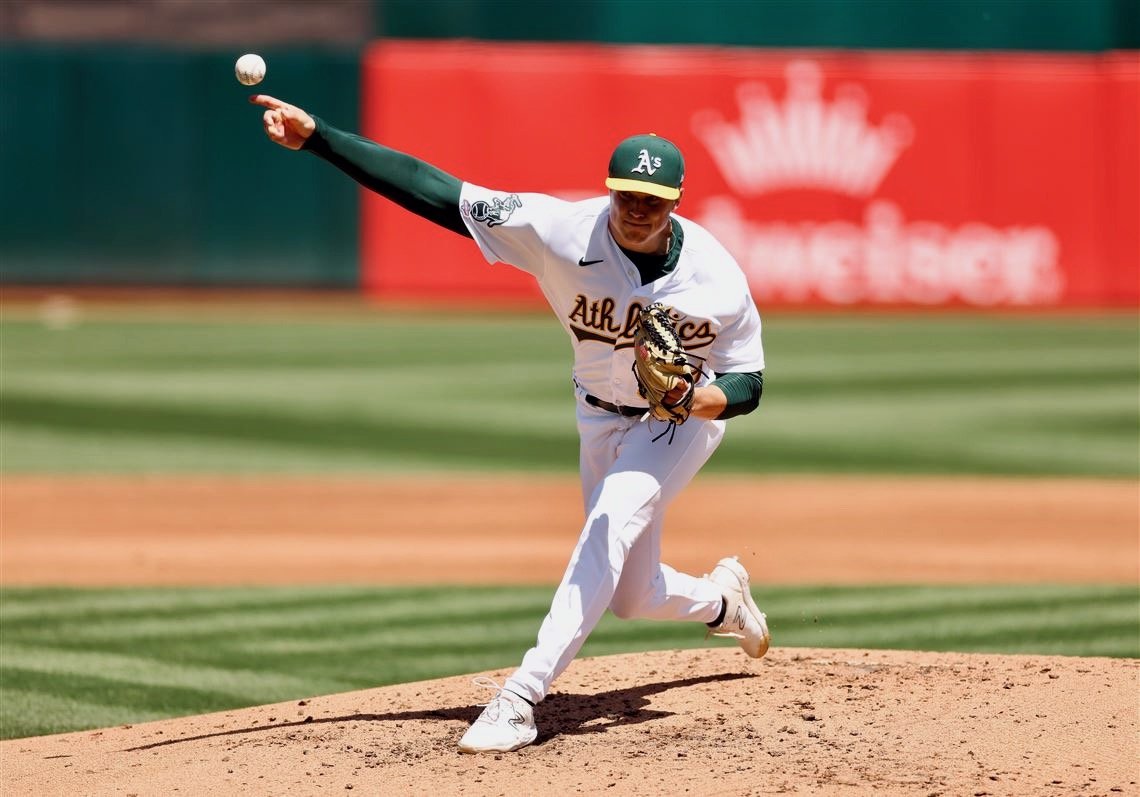
Is Mason Miller Still King?
Just over one month into the MLB season, we have a sample size large enough for our first xwFIP leaderboard of the year. Is Mason Miller still king?
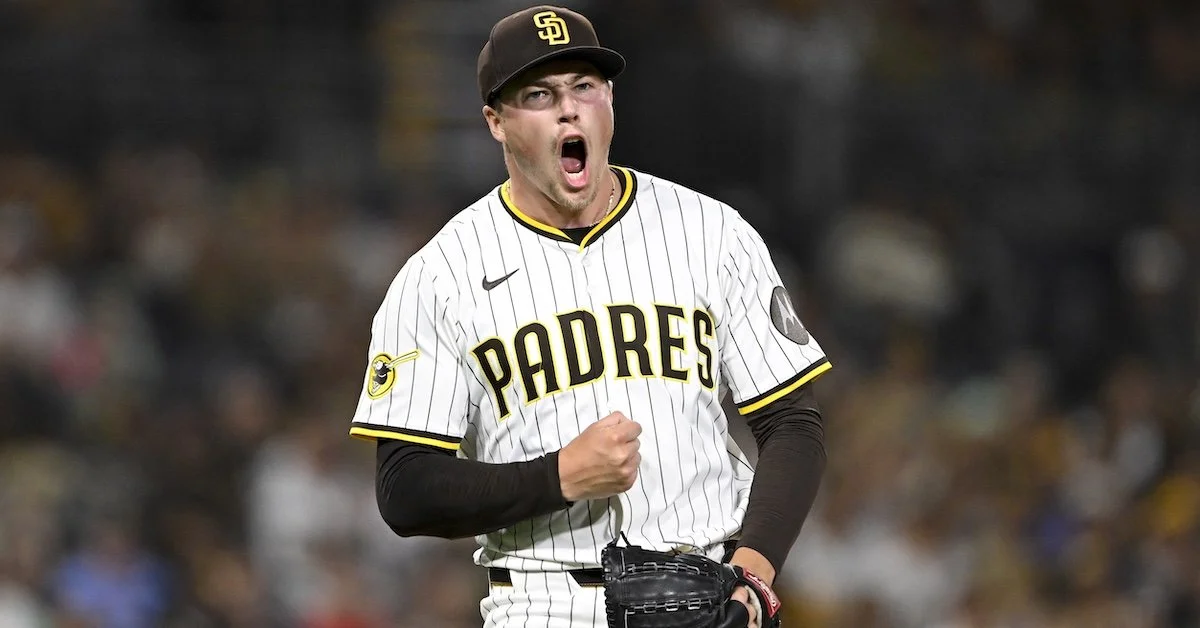
Which Playoff Teams Have the Most Dominant Pitching?
October baseball is in full swing, and the Wild Card round didn’t disappoint! We saw some stunning upsets: the Tigers ousted the Astros, the Royals knocked out the Orioles, the Mets took down the Brewers, and the Padres triumphed over the Braves in the only series in which the home team won. Now, with just eight teams remaining, it's time for my final xwFIP analysis of the season. I'll be crowning the regular season champions among all pitchers and starters, and taking a deep dive into which playoff pitching staffs are best equipped to silence opposing lineups this fall.
Photo Credit: Frank Franklin II/Associated Press

Introducing pWAR and Using It to Predict Who Wins Cy Young
Who will win the AL and NL Cy Young Awards? In this analysis, I’ll introduce a new cumulative win value statistic, Paraball Wins Above Replacement, orpWAR, in order to identify the most deserving candidates.
Photo Credit: Any Lyons/Getty Images

What Were The Best Trade Deadline Pitching Acquisitions, According to xwFIP?
Following the recent trade deadline, I’ll take a closer look at the ten best pitching acquisitions of 2024. Which team made the best acquisitions, judging by pitching metric xwFIP? And how does the xwFIP leaderboard stack up for all pitchers this season through July?
Photo Credit: Getty Images

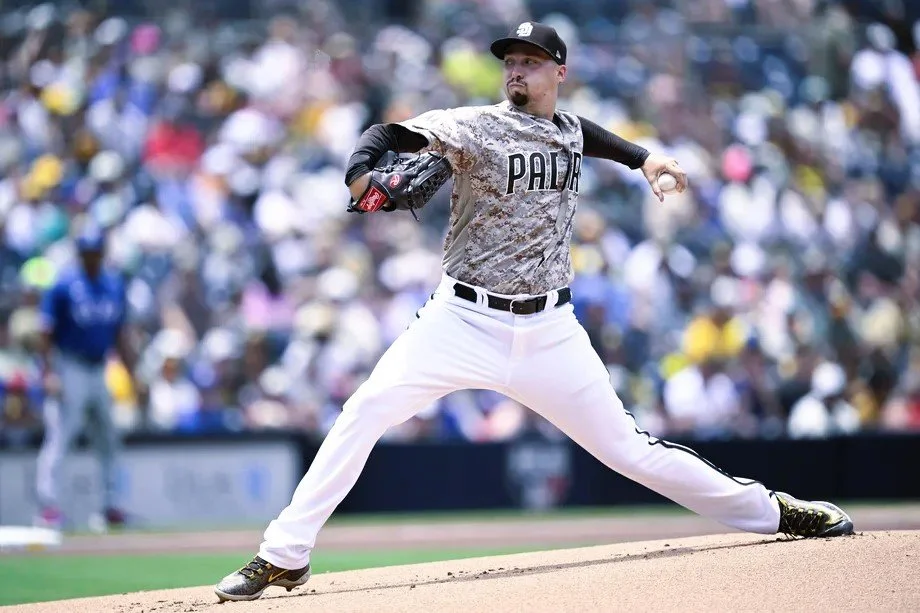
The Second Best Starter in Baseball is a Converted Reliever
Garrett Crochet pitched 72 games and 73 innings as a reliever from 2020 to 2023, missing the entire 2022 season recovering from Tommy John surgery. The White Sox, desperate for starting pitching, saw something they liked in Crochet and gave him a chance to start in 2024. Crochet has not disappointed, ranking 2nd among starting pitchers in xwFIP through June. If traded later this month, he can quickly retool Chicago’s farm system.
At the end of April, Crochet ranked 6th among starters with a 2.98 xwFIP, despite a 6.37 ERA and a 4.20 FIP. At the end of May, Crochet’s ranking was up to 3rd among all pitchers and 1st among starters with a 2.02 xwFIP, despite an ERA of 3.49 and a FIP of 3.00. Now, through June, Crochet is 2nd among starters and 6th among all pitchers with a 2.71 xwFIP, and his ERA and FIP have dropped to 3.02 and 2.47, respectively.
Photo Credit: John J. Kim/Chicago Tribune

Where Does The Performance of Top Pitching Prospect Paul Skenes Rank?
Pirates rookie right-hander Paul Skenes has debuted his electric stuff with 30 strikeouts over 4 starts and 22 innings pitched. Skenes, baseball’s number one pitching prospect and number two overall prospect, was drafted 1st overall out of LSU last year. He features a 99 mph 4-seamer, a 94 mph splitter, and an 85 mph slider; and he ranks in the 99th percentile in fastball velocity and the 98th percentile in strikeout rate.
Where does Skenes stack in this month’s xwFIP rankings?
Photo Credit: Jonathan Dyer/USA TODAY Sports
The Pitchers with the Best xwFIP: April Edition
This past offseason, I introduced the pitching metric xwFIP in a series of three posts. xwFIP is an advanced fielding independent pitching metric that not only takes into account walks, hit batsmen, strikeouts, and homeruns, but also the xwOBA on batted balls. The metric takes into account nearly 100% of plate appearances in its calculation. Moreoever, I have showcased that it has greater predictive power than each of ERA, wOBA, FIP, xFIP, xwOBA, and SIERA in predicting future run prevention performance of a pitcher.
This season, I’ll be posting the xwFIP leaderboard each month so we can see the starters and relievers that are most likely to have continued success, along with the pitchers who have been lucky and unlucky so far.
Photo Credit: Ezra Shaw/Getty Images

The Updated xwFIP
I received a very good comment from reader Light_Saberist on one of my latests posts, in which I compared the predictive powers of xwFIP and FIP.
In order to determine the xHR of a pitcher, xFIP (not to be confused with xwFIP) uses the league average homerun/flyball rate of 10.5% and multiplies that rate by the number of flyballs the pitcher allows. This logic may mitigate some of the luck factors in allowing homeruns and thus strengthen xwFIP as well. I checked that hypothesis, and it was correct!
Photo Credit: Daniel Varnado

Comparing The Predictive Powers of xwFIP and FIP
In my previous post, I introduced an enhanced version of FIP - named xwFIP - which incorporates batted ball data and 100% of plate appearances while remaining completely fielding independent. But how is xwFIP’s ability to predict future pitching success? Let’s have a look.
Photo Credit: The Athletic
Introducing xwFIP: An Expansion of Baseball’s Most Powerful Pitching Statistic
Since Tom Tango introduced Fielding Independent Pitching (FIP) to the baseball community around the year of 2009, the metric has been the gold standard for evaluating pitching performance. Tango has effectively proven that FIP is a better predictor of future pitching success than ERA. FIP’s special sauce is its ability to filter for outcomes that are directly related to pitcher performance—home runs, walks, hit batsmen, and strikeouts. Since it’s difficult for the baseball community to assign credit or blame for groundouts, flyouts, and base hits, all of which are largely dependent on the ability of the pitcher’s fielders, these outcomes are treated equally.
Homeruns, walks, hit batsmen, and strikeouts accounted for only 35.7% of plate appearances (PAs) in 2023. However, if we are able to add batted ball data* to FIP, while keeping the metric completely independent of fielding, we can cover 100% of PAs. In this analysis, I will have a go at doing exactly that.
Photo Credit: Orlando Ramirez/USA TODAY Sports