Introducing xwFIP: An Expansion of Baseball’s Most Powerful Pitching Statistic

Photo Credit: Orlando Ramirez/USA TODAY Sports
Since Tom Tango introduced Fielding Independent Pitching (FIP) to the baseball community around the year of 2009, the metric has been the gold standard for evaluating pitching performance. Tango has effectively proven that FIP is a better predictor of future pitching success than ERA. FIP’s special sauce is its ability to filter for outcomes that are directly related to pitcher performance—home runs, walks, hit batsmen, and strikeouts. Since it’s difficult for the baseball community to assign credit or blame for groundouts, flyouts, and base hits, all of which are largely dependent on the ability of the pitcher’s fielders, these outcomes are treated equally.
Homeruns, walks, hit batsmen, and strikeouts accounted for only 35.7% of plate appearances (PAs) in 2023. However, if we are able to add batted ball data* to FIP, while keeping the metric completely independent of fielding, we can cover 100% of PAs. In this analysis, I will have a go at doing exactly that.
In order to incorporate batted ball data into FIP, I started by filtering out all 2023 PAs that resulted in a homerun, walk, hit by pitch, or strikeout. I want to keep those factors in the FIP model just as they have been for well over a decade, and avoid double-counting PAs. From the remaining dataset of batted balls, I was able to compute each pitcher’s xwOBAbip, which is the xwOBACON of the pitcher excluding the homeruns he’s given up. The average xwOBAbip of all pitchers with at least 50 IP in 2023 was 0.319, a number very close to the league average wOBA and xwOBA of .315 and .316, respectively.
After finding each pitcher’s xWOBAbip, my next step was to convert that metric into a run value by comparing it to the league average mark of 0.319. I was able to do that by using the heuristic that “20 points of wOBA over 600 PAs is worth 10 runs”. Next, the run value was added to the FIP numerator and scaled up by an empirical factor of 9. The factor of 9 was used to maintain the proportionality between the FIP numerator and runs values, analogous to the derivation of the FIP factors for homeruns, walks and hit batsmen, and strikeouts. Lastly, the FIP constant was kept the same, leading to an identical league wide FIP average.
Table 1 lists the 25 pitchers with the greatest expected run prevention improvement when shifting from FIP to xwFIP.

Table 1: The 25 pitchers with the greatest expected run prevention improvement when shifting from FIP to xwFIP
Here, relievers George Soriano and Ryne Stanek have the greatest boost in their 2023 metrics when using xwFIP instead of FIP.
Another notable pitcher on this list is Blake Snell, the winner of the NL Cy Young award. Throughout the 2023 season, Snell demonstrated exceptional proficiency in preventing runs, earning him the Cy Young award despite ranking 6th in the NL with a 3.44 FIP. Snell's ability to consistently generate swings and misses or weak contact more than made up for his elevated walk rate in 2023, and is reflected well in his elite 3.01 xwFIP.

Table 2: The 25 pitchers with the greatest expected run prevention regression when shifting from FIP to xwFIP
Tyler Holton and Dean Kremer top the list of pitchers with the greatest drop in their 2023 metrics when using xwFIP instead of FIP.
Pitchers also worth noting in Table 2 are Guardians closer Emmanuel Clase and AL Cy Young award winner Gerrit Cole. Clase - whose 3.44 xwFIP does not put him in the same elite tier as his 2.92 FIP - is on the trading block this offseason. Cole - whose 3.17 FIP ranked 4th in the AL in 2023 - had an xwFIP of 3.68 and may experience regression in his run prevention statistics in 2024.
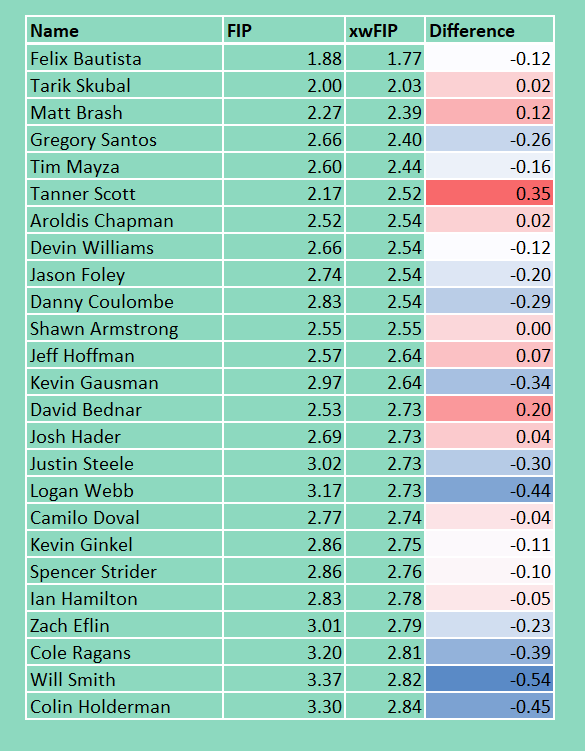
Table 3: The 25 pitchers with the lowest xwFIP in 2023
Table 3 lists the 25 pitchers with the lowest xwFIP in the 2023 season.
Felix Bautista’s dominant 2023 season - a performance that had him in the AL Cy Young conversation before he went down with an elbow injury that is expected to sideline him for all of 2024 - was even more dominant from an xwFIP perspective.
In fact, Table 3 is mostly populated by the nastiest relivers in baseball. For instance, Aroldis Chapman, Devin Williams, David Bednar, Josh Hader, Camilo Doval, and Kevin Kinkel are all present. They are joined by starters Tarik Skubal, Kevin Gausman, Justin Steele, Logan Webb, Spencer Strider, and Zach Eflin.

Table 4: The 25 starting pitchers (with at least 15 starts) with the lowest xwFIP in 2023
The 25 starting pitchers with the lowest xwFIP in the 2023 season are listed in Table 4.
From the table, it is evident that Tiger’s lefty Tarik Skubal is a pitcher to watch heading into 2024 after pitching to the lowest FIP and xwFIP by a significant margin among all starters with at least 15 starts.
Furthermore, Gausman, Steele, Webb, Strider, and Eflin are joined by Zach Wheeler in the exclusive club of seven starting pitchers with an xwFIP of less than 3.00. Snell, Tyler Glasnow, and Sonny Gray are in the next tier of starters with an xwFIP of less than 3.20.
Figure 1 and Figure 2 below illustrate the breakdown of the FIP and xwFIP numerators, respectively. The dataset is sorted by the number of starts, so the pitchers on the left side of the graphs, who have the most innings pitched, also have the greatest magnitude of run values.
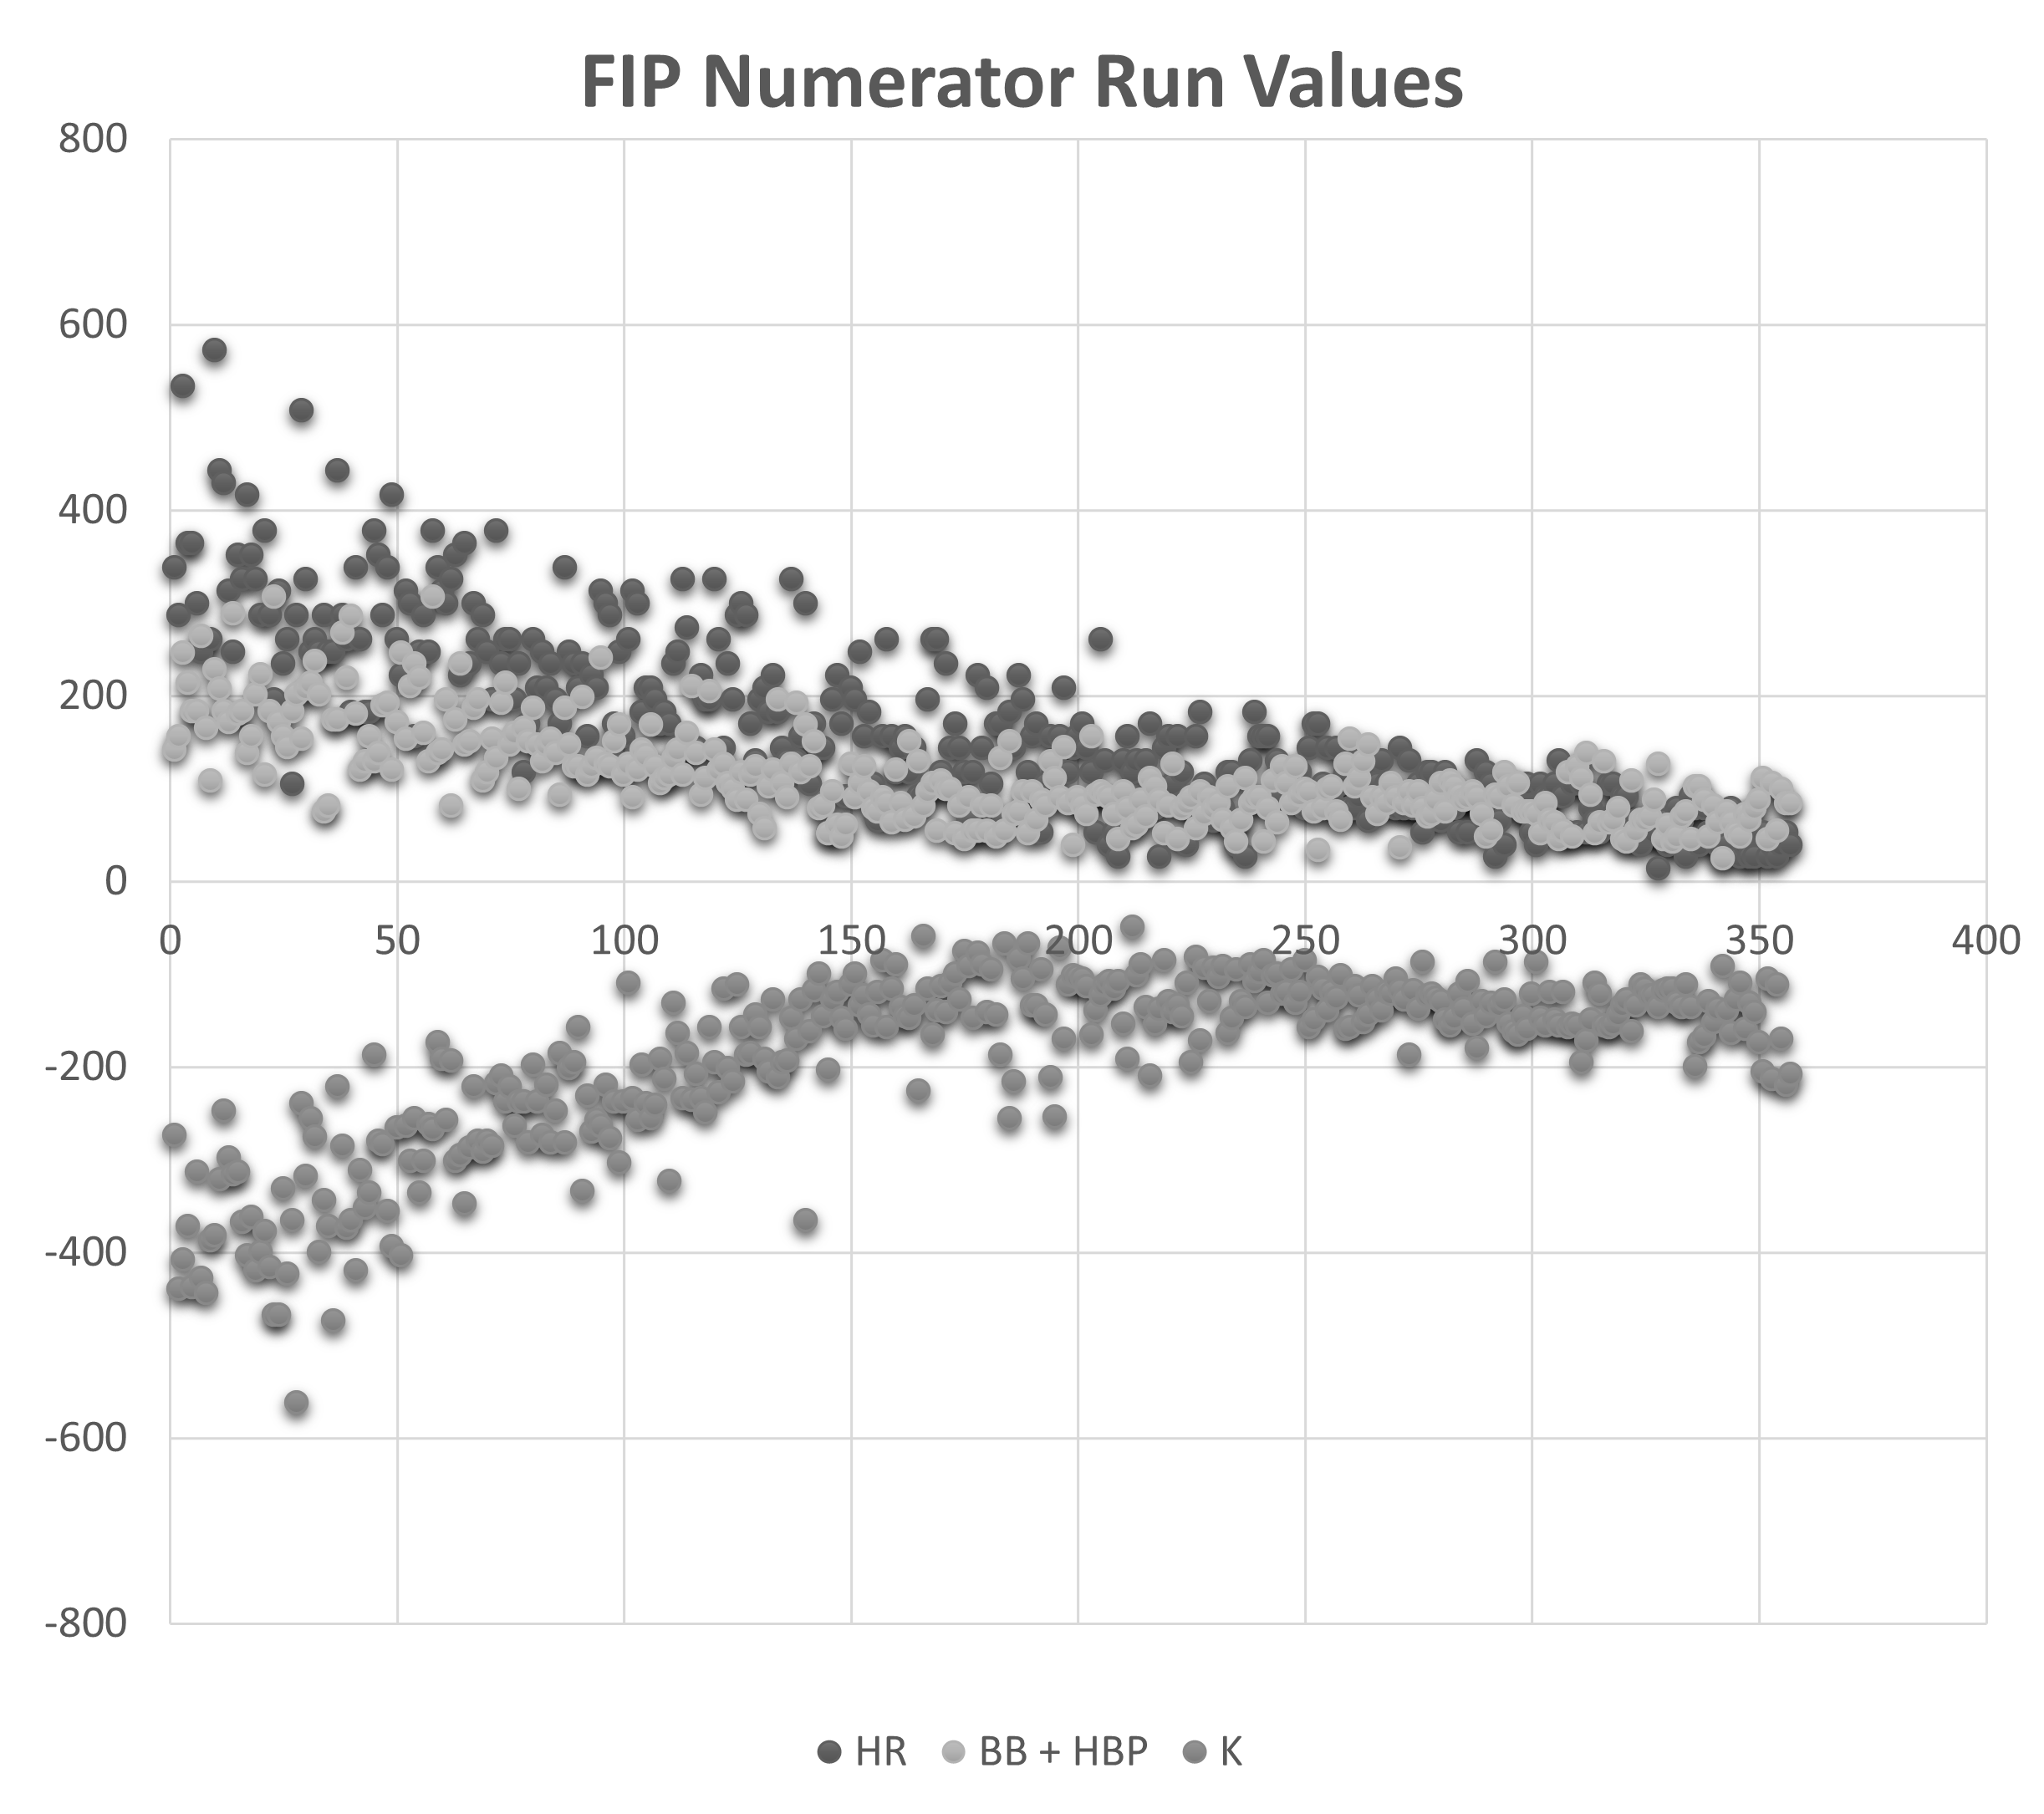
Figure 1: FIP Numerator components, with y-axis being the magnitude of the FIP numerator contribution for each of the 358 pitchers with at least 50 IP in 2023

Figure 2: xwFIP Numerator components, with the y-axis being the magnitude of the xwFIP numerator contribution for each of the 358 pitchers with at least 50 IP in 2023
Homeruns allowed and strikeouts are the two most important FIP and xwFIP factors in magnitude, both being the furthest away from the x-axis of zero contribution on average. Furthermore, walks and hit batsmen is the least important FIP factor and third most important xwFIP factor, albeit clearly a significant one.
Lastly, xwOBAbip serves as the least important factor for xwFIP: despite being the least important factor, it has valuable and informative deviations from the zero contribution x-axis on many occasions (evidenced in Table 1 through Table 4).
In summary, xwFIP improves the scope of FIP to include 100% of PAs by incorporating valuable batted ball data while remaining entirely fielding independent.
*This is currently only possible in the Statcast era and going back into the video archives to estimate the exit velocity and launch angle of batted balls in the pre-Statcast era does seem like a Herculean task.